Product Preview
See it in action
A free dividend FIRE calculator that runs entirely in your browser — no accounts, no servers.
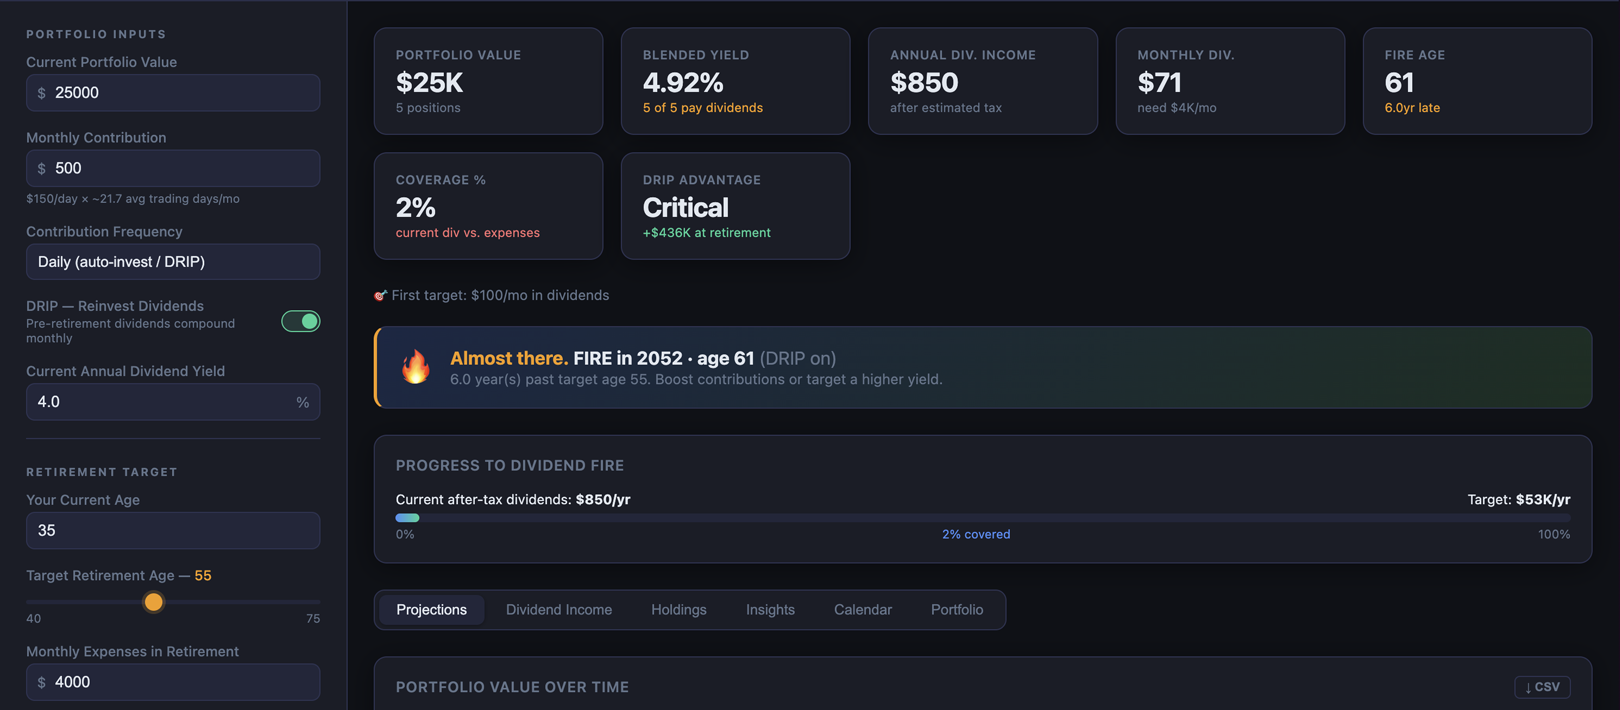
Portfolio Dashboard
Your FIRE date, dividend coverage, and full holdings at a glance — updated live as you move any slider.
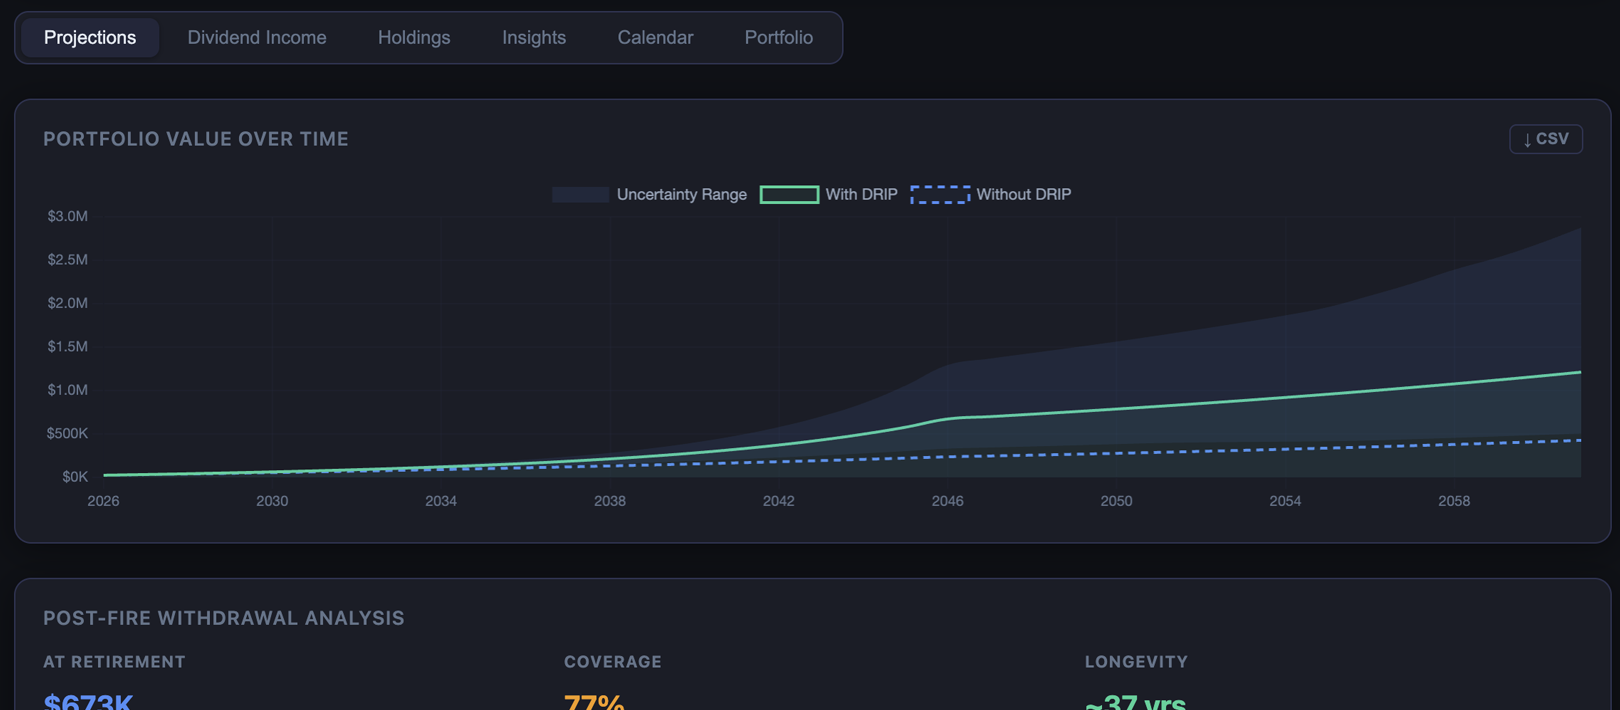
30-Year Projection + Monte Carlo Bands
Side-by-side DRIP comparison with a shaded uncertainty range (10th–90th percentile) so you can see the realistic spread of outcomes, not just one line.
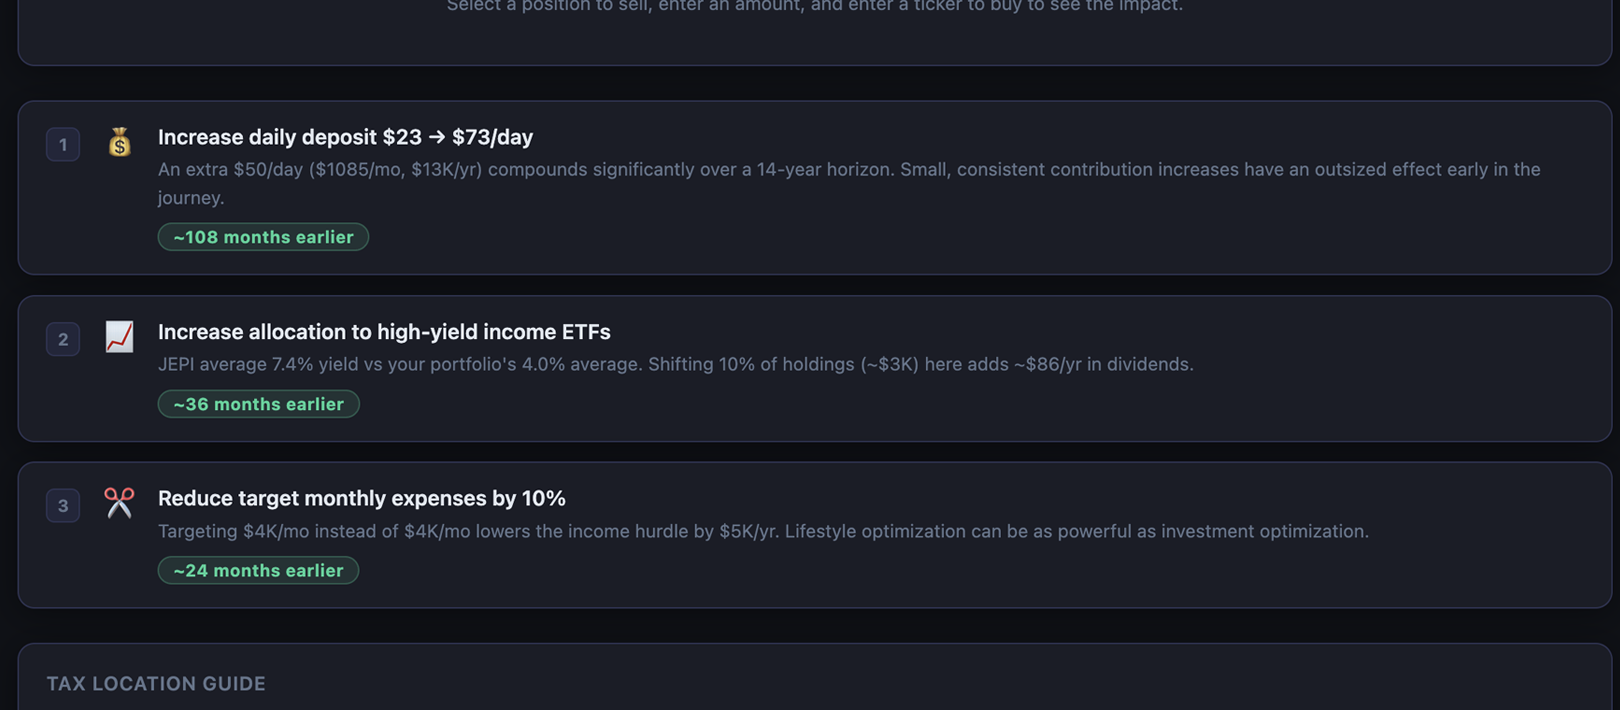
FIRE Optimization Insights
Ranked, specific recommendations based on your actual holdings — with exact dollar amounts for each suggested shift.
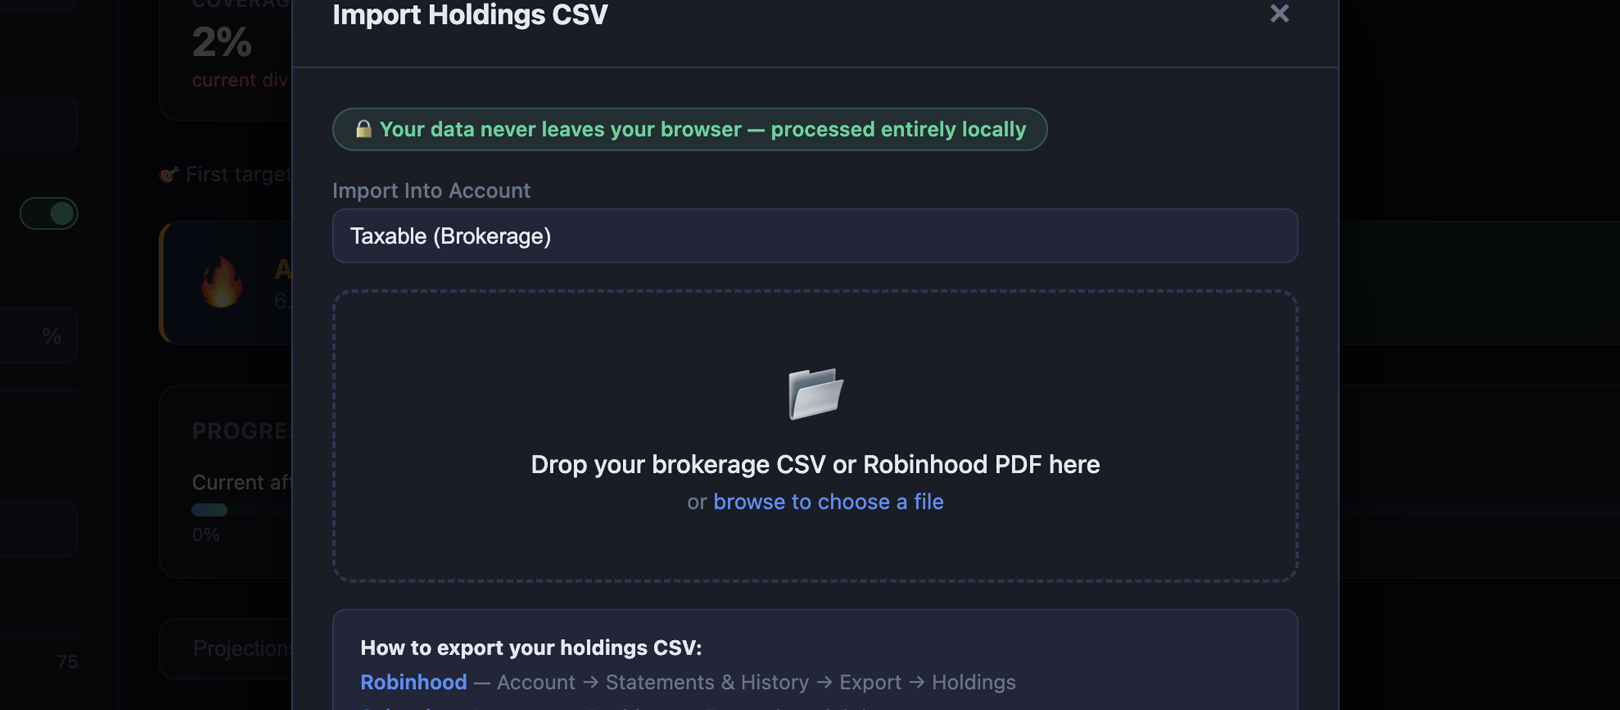
One-Step Import
Drop your brokerage CSV, preview every detected position, then apply. The entire process takes under 30 seconds.